Inspiration
In this record, we explore basic finance data, models, and definitions essential for understanding the intricate workings of the financial world. Whether you’re a beginner or seeking a refresher, this resource is your gateway to acquiring essential skills for analyzing financial markets. Join me on this journey to unlock the key concepts necessary for navigating the dynamic landscape of finance.
CheatSheets
Glossary cheatsheet with the focus on financial data modeling.
Various asset class characteristics (equities, options, futures, etc.) and corresponding reference data.
Trading algorithms, quantitative, pricing or risk models.
Financial data structures
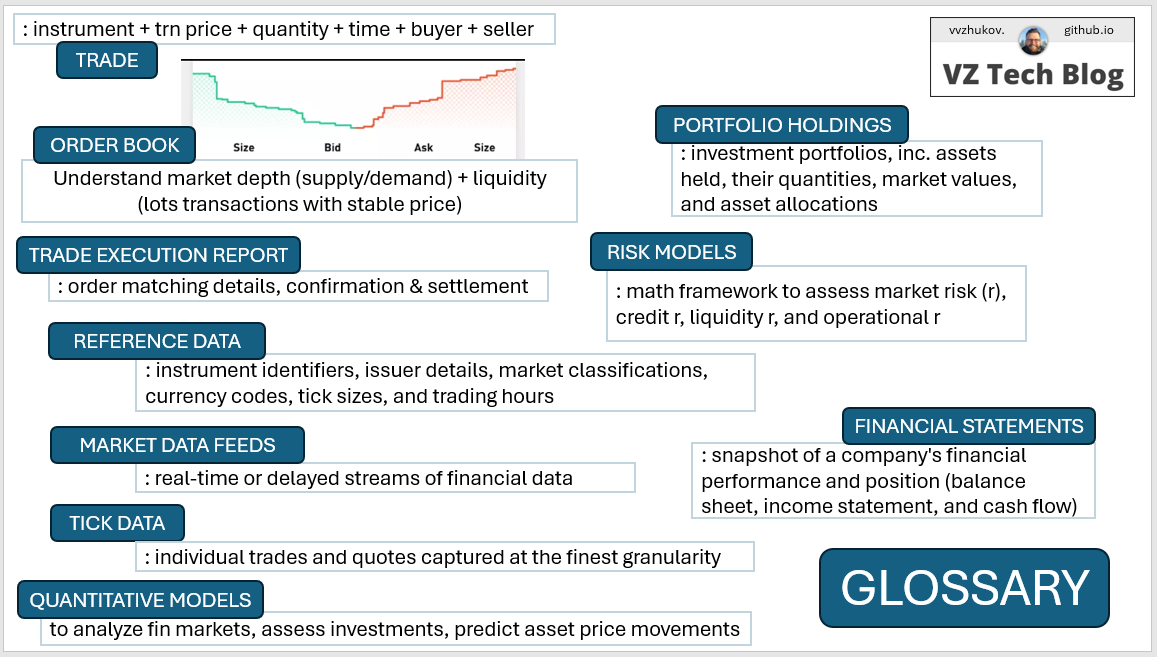
1. Trades: transactions where financial assets, such as stocks, bonds, or derivatives, are bought or sold at a specified price and quantity. Typically includes details such as the instrument traded, transaction price, quantity, time of execution, buyer and seller identities, and venue where the trade occurred.
2. Order Book Data: dynamic record of buy and sell orders for a particular financial instrument, organized by price level. It provides insights into market depth (measure of the supply and demand for liquid, tradeable assets), liquidity (measure of the ability of market participants to undertake securities transactions without triggering large changes in their prices), and potential price movements. Includes details such as the price and quantity of each order, order type (market or limit), order timestamp, and order status (open, filled, cancelled).
3. Trade Execution Reports: provide comprehensive information about the execution of trades, including details on order matching, trade confirmation, and settlement. These reports summarize the outcome of trades, capturing important metrics such as execution price, trade volume, execution venue, and any associated fees or commissions. Trade execution reports facilitate post-trade analysis, compliance monitoring, and reconciliation processes for market participants.
4. Reference Data: comprises static information about financial instruments, counterparties, and market entities. It includes attributes such as instrument identifiers (e.g., ISIN, CUSIP), issuer details, market classifications, currency codes, tick sizes, and trading hours. Reference data serves as a foundation for trade processing, risk management, and regulatory reporting activities. It ensures consistency and accuracy in financial transactions by providing standardized information across systems and platforms.
5. Market Data Feeds: deliver real-time or delayed streams of financial data to market participants, encompassing trades, quotes, order book updates, and other relevant information. These feeds are disseminated by exchanges, trading venues, and data vendors, catering to diverse market participants, including traders, investors, and algorithmic trading systems. Market data feeds enable market surveillance, price discovery, and algorithmic trading strategies by providing timely access to market information.
6. Tick Data: Tick data consists of individual trades and quotes captured at the finest granularity, typically recorded with millisecond or microsecond precision. It provides detailed information about each transaction, including trade price, trade volume, bid and ask prices, bid and ask sizes, and timestamp. Tick data is essential for high-frequency trading (HFT), algorithmic trading strategies, backtesting models, and market microstructure analysis.
7. Time Series Data: represents sequential observations of a particular variable over successive time intervals. In finance, time series data encompasses various metrics such as stock prices, exchange rates, interest rates, economic indicators, and volatility measures (how much and how quickly prices move over a given span of time). Analyzing time series data allows for trend identification, pattern recognition, and statistical forecasting, aiding in investment decision-making and risk management.
8. Portfolio Holdings: data details the composition of investment portfolios, including the specific assets held, their quantities, market values, and asset allocations. It provides insights into portfolio diversification, risk exposure, and performance attribution. Portfolio holdings data is essential for portfolio managers, asset allocators, and risk analysts to monitor and optimize investment portfolios.
9. Transaction Logs: record a chronological sequence of all financial transactions processed within a system or platform. These logs capture information such as transaction type, transaction ID, timestamp, user identities, and transaction status. Transaction logs are vital for audit trails, compliance monitoring, troubleshooting, and forensic investigations in financial systems.
10. Risk Models: Risk models represent mathematical frameworks used to quantify and assess various types of financial risk, including market risk, credit risk, liquidity risk, and operational risk. These models incorporate data inputs such as asset prices, volatilities, correlations, credit ratings, and economic indicators to estimate the likelihood and impact of adverse events on portfolios and financial institutions.
11. Financial Statements: Financial statements are structured reports that provide a snapshot of a company’s financial performance and position, typically comprising the balance sheet, income statement, and cash flow statement. These statements present key financial metrics such as revenue, expenses, assets, liabilities (what a business owes), and equity (company’s book value), facilitating analysis by investors, creditors, and analysts to evaluate the financial health and prospects of a business.
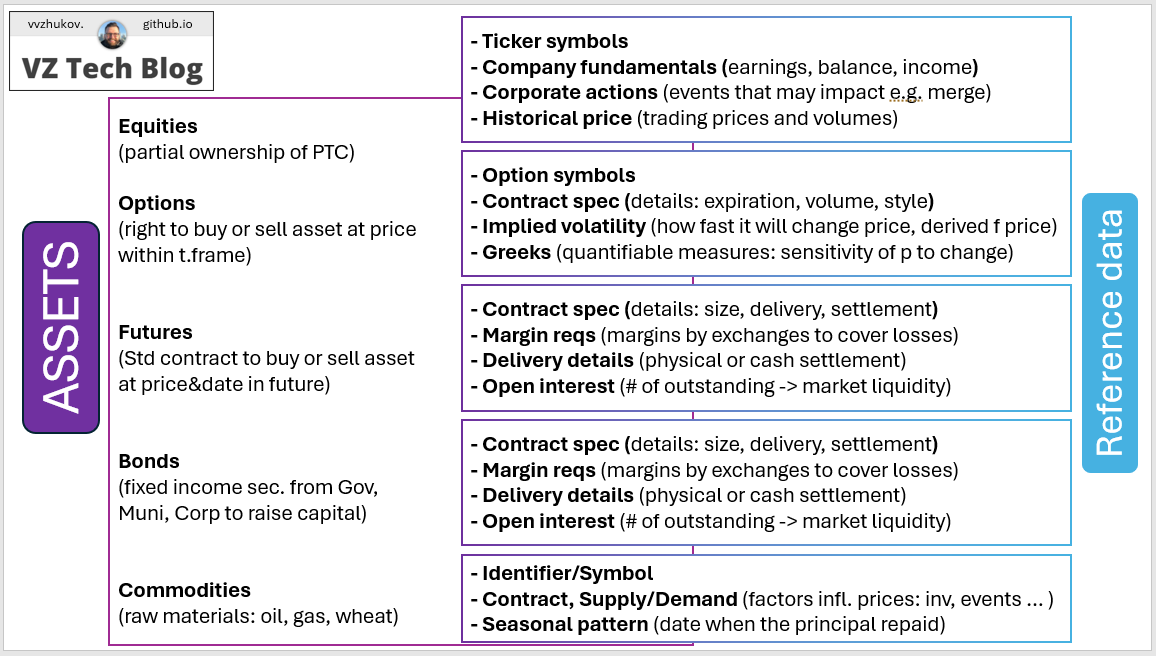
Asset class characteristics and corresponding reference data
1. Equities represent ownership stakes in publicly traded companies. Investors buy and sell shares of stock, which entitle them to a portion of the company’s profits and assets.
Reference data
- Ticker symbols: Unique identifiers assigned to each stock for trading purposes.
- Company fundamentals: Information about the issuing company, such as earnings reports, balance sheets, and income statements.
- Corporate actions: Details of events that may affect stock prices, such as dividends, stock splits, mergers, and acquisitions.
- Historical price data: Historical trading prices and volumes, which are crucial for technical analysis and investment research.
2. Options are financial derivatives that provide the buyer with the right, but not the obligation, to buy (call option) or sell (put option) an underlying asset at a predetermined price (strike price) within a specified time frame. Spot price = market price at the current moment. EU (only execute option on expiration date) / NA (flexible, any point in time).
Reference data:
- Option symbol: Unique identifier comprising the underlying asset, expiration date, and strike price.
- Contract specifications: Details about contract size, expiration cycle, exercise style, and settlement method.
- Implied volatility: Expected volatility of the underlying asset, derived from option prices, which influences option pricing and risk management.
- Greeks: Measures such as delta, gamma, theta, and vega, which quantify the sensitivity of option prices to changes in underlying variables.
3. Futures are standardized contracts to buy or sell a specified quantity of an underlying asset at a predetermined price and date in the future.
Reference data:
- Futures contract specifications: Details about the underlying asset, contract size, delivery months, and settlement method.
- Margin requirements: Initial and maintenance margins set by exchanges to cover potential losses from futures positions.
- Delivery details: Procedures for physical or cash settlement, including delivery locations and specifications.
- Open interest: Number of outstanding futures contracts, which reflects market liquidity and investor sentiment.
4. Bonds are fixed-income securities issued by governments, municipalities, or corporations to raise capital. Bondholders receive periodic interest payments (coupons) and repayment of the principal at maturity.
Reference data:
- Bond identifiers: Unique codes such as CUSIP or ISIN used to identify individual bonds.
- Issuer information: Details about the entity issuing the bond, including credit ratings, financial statements, and bond prospectus.
- Coupon rate and maturity date: Interest rate paid by the bond and date when the principal is repaid.
- Yield curve: Term structure of interest rates, showing the relationship between bond yields and maturities.
5. Commodities are raw materials or primary agricultural products that are traded on exchanges. Examples include crude oil, gold, wheat, and natural gas.
Reference data:
- Commodity symbols: Codes used to identify specific commodities in trading platforms.
- Contract specifications: Details about contract size, delivery months, quality standards, and trading hours.
- Supply and demand fundamentals: Factors influencing commodity prices, such as production levels, inventory data, geopolitical events, and weather conditions.
- Seasonal patterns: Historical trends in commodity prices related to seasonal variations in supply and demand.
Trading algorithms, quantitative, pricing and risk models
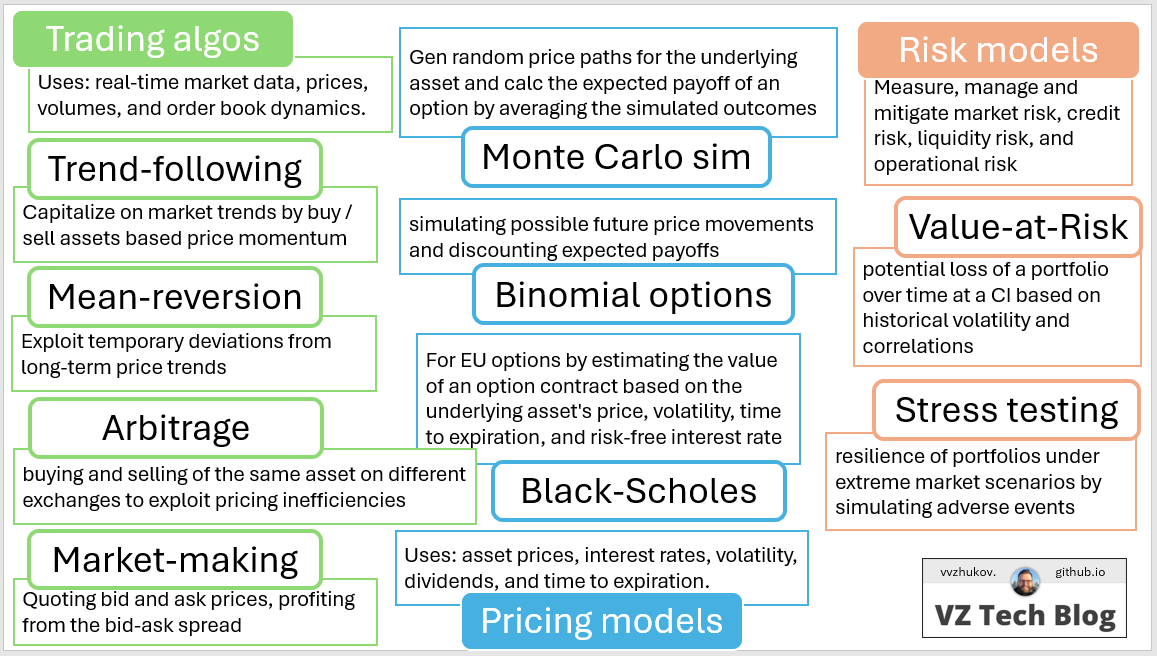
Trading algorithms, also known as algos or automated trading systems, are computer programs designed to execute trading decisions based on predefined rules and criteria.
These algorithms leverage real-time market data, such as prices, volumes, and order book dynamics, to generate buy or sell signals and execute trades swiftly and efficiently.
Types:
- Trend-following: Identify and capitalize on market trends by buying or selling assets based on price momentum.
- Mean-reversion: Exploit temporary deviations from long-term price trends, aiming to profit from price reversals.
- Arbitrage: Capitalize on price discrepancies between related assets or markets, such as simultaneous buying and selling of the same asset on different exchanges to exploit pricing inefficiencies.
- Market-making: Provide liquidity to markets by continuously quoting bid and ask prices, profiting from the bid-ask spread.
- Execution: Optimize trade execution by minimizing market impact, slippage, and transaction costs while achieving desired trading objectives.
Quantitative Models are mathematical frameworks used to analyze financial markets, assess investment opportunities, and predict asset price movements. Q models incorporate statistical techniques, mathematical formulas, and historical data to quantify market dynamics, risk factors, and investor behavior.
Types:
- Statistical: regression analysis, time series analysis, and machine learning algorithms to identify patterns, correlations, and predictive relationships in financial data.
- Econometric: Integrate economic theory with statistical methods to model relationships between economic variables and financial markets.
- Factor: Decompose asset returns into systematic factors (e.g., market risk, interest rate risk, sector-specific risk) to assess portfolio risk exposure and performance attribution.
- Machine learning: Employ advanced algorithms, such as neural networks and support vector machines, to analyze large datasets, detect patterns, and make predictions in complex and dynamic market environments.
Pricing models are mathematical frameworks used to determine the fair value of financial instruments (such as stocks, options, futures, and derivatives). P models incorporate factors such as underlying asset prices, interest rates, volatility, dividends, and time to expiration to estimate the theoretical price of an instrument.
Types:
- Black-Scholes: Used to price European-style options by estimating the value of an option contract based on the underlying asset’s price, volatility, time to expiration, and risk-free interest rate.
- Binomial options: Provides a discrete-time framework for pricing options by simulating possible future price movements and discounting expected payoffs.
- Monte Carlo simulation: Generates multiple random price paths for the underlying asset and calculates the expected payoff of an option by averaging the simulated outcomes.
- Interest rate: Model the dynamics of interest rates and yield curves to price fixed-income securities, such as bonds, swaps, and mortgage-backed securities.
Risk models are quantitative tools used to measure, manage, and mitigate various types of financial risk, including market risk, credit risk, liquidity risk, and operational risk.
Types:
- Value-at-Risk (VaR): Estimate the maximum potential loss of a portfolio over a specified time horizon at a given confidence level, based on historical volatility and correlations.
- Stress testing: Evaluate the resilience of portfolios under extreme market scenarios by simulating adverse events, such as market crashes, interest rate shocks, or geopolitical crises.
- Credit risk: Assess the probability of default and potential loss on credit investments, such as bonds, loans, and derivatives, based on borrower creditworthiness and macroeconomic factors.
- Scenario analysis: Analyze the impact of predefined scenarios on portfolio returns and risk metrics, allowing investors to evaluate the sensitivity of their portfolios to changing market conditions.